
|
Downloads
Wiki
Build CodeLite
Devs
|
Main /
DebugWithLLDBOn this page... (hide) IntroductionLLDB is a next generation, high-performance debugger. It is built as a set of reusable components which highly leverage existing libraries in the larger LLVM Project, such as the Clang expression parser and LLVM disassembler. LLDB is now the default debugger on Mac OS X and supports debugging C, Objective-C and C++ on the desktop and iOS devices and simulator. Note that the LLDB debugger plugin is not supported on all the platforms that codelite supports. The table below describes lists what is available:
Under the hoodIn this section I will attempt the explain the design chosen for the implementation of the LLDB debugger plugin, and the rationale behind it.
CodeLite uses a small executable named The This design was chosen to accomplish three main goals:
For a simple debug session (i.e. no remote debugging and no cross-user debugging) there is 0 (zero) configuration needed to be done by the user. Configuring CodeLite to use LLDBSelecting LLDB as the default debugger for a project is easily done from the project settings: right-click on the project and navigate to 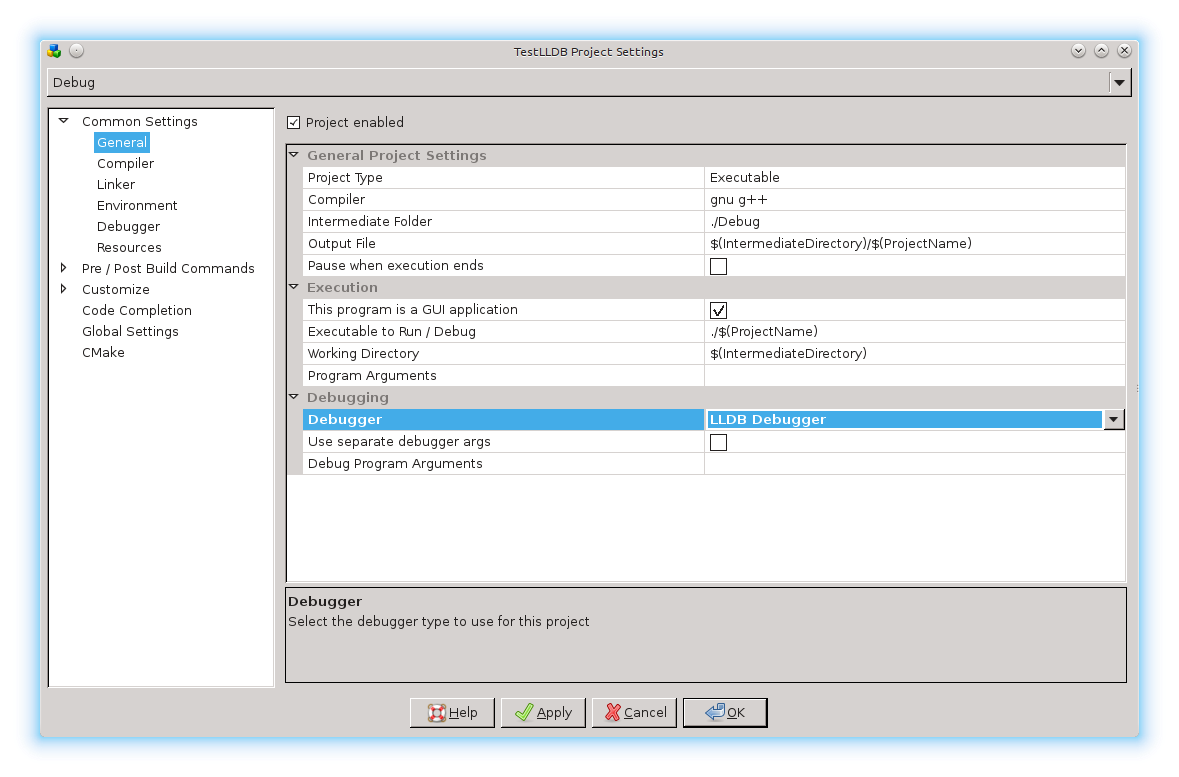 You can also select LLDB as the default debugger when using the New Project Wizard: 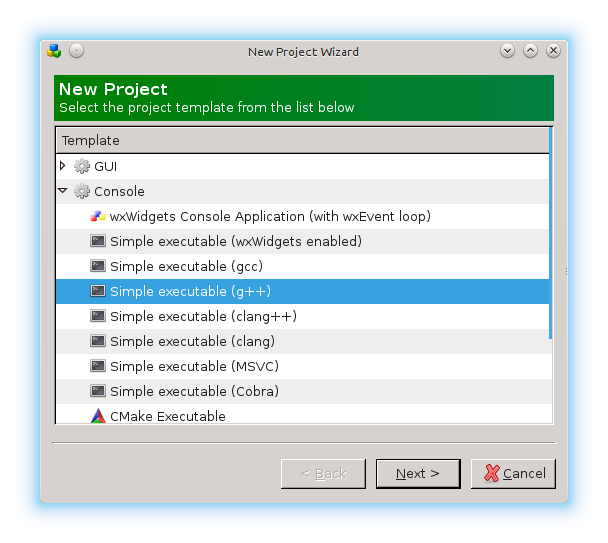 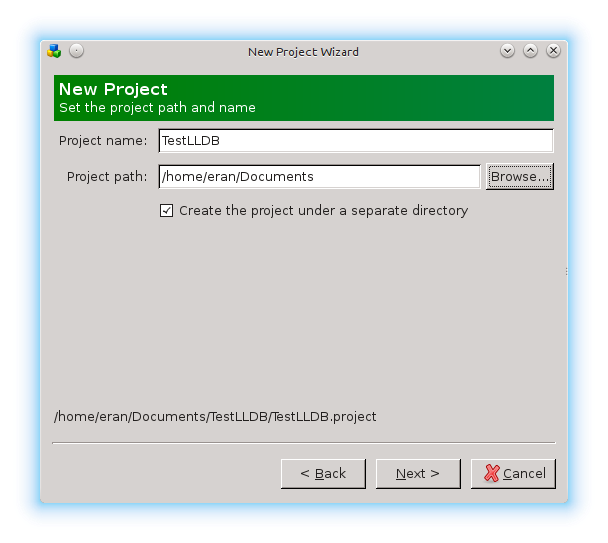 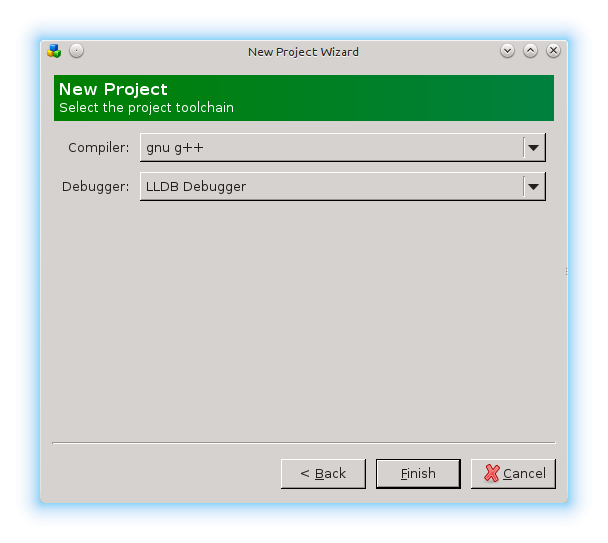 Of course, you can also select LLDB as your debugger from the following dialogs:
The LLDB PerspectiveAt the time of writing this wiki document, LLDB manages its own perspective layout. The perspective is loaded/unloaded automatically when the debug session starts. At the moment, all 4 LLDB panes will be shown each time you start a debug session (this might change in the future). Below is a screenshot of the typical LLDB layout during debug session:  There are 4 panes: The breakpoints pane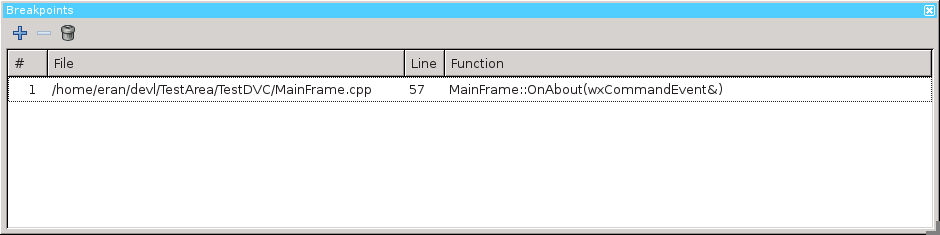 This is the typical breakpoints pane, similar to the GDB one (though with fewer options). You can choose whether to:
When clicking on the '+' button, you will be prompted with the 'Add New Breakpoint' dialog. 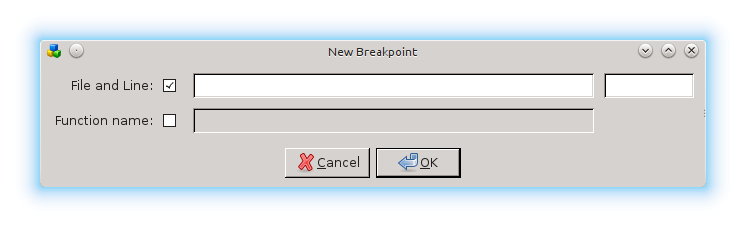 You can define breakpoints in 2 ways:
Double-clicking a breakpoint entry will jump to its location. The Threads View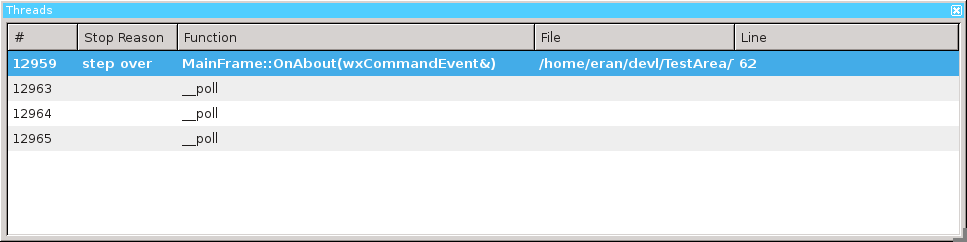 The thread view provides information about the threads running in your program. Double-clicking on a thread will make it active (i.e. the call-stack view will be updated to reflect that thread's backtrace). The active thread is shown in bold. The Callstack View This view displays the active thread's frames (aka backtrace). The active frame is marked in bold i.e. the Locals View will always show that frame's variables (function arguments, local arguments and 'this'). To switch between frames, double-click on the frame you want to view. The Locals View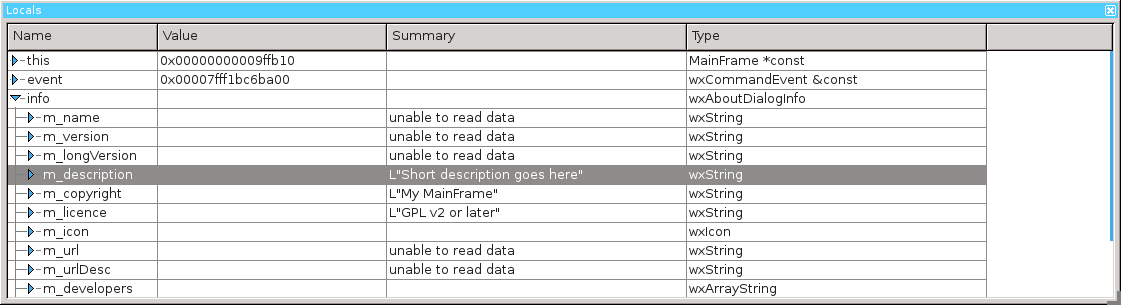 This view displays the active frame variables:
Data formattersTo read about LLDB data formatters, please read this article from the LLDB website. When a debug session starts, the plugin will "source" the file ~/.lldbinit so you should place there any custom commands to be executed before the session starts. This is where you want to place your python printers. Python printersOne of the powerful features of LLDB is python printers. You can use python to provide an alternate "summary" field which will be displayed in the Locals View. As an example for such printer, consider the QString class from the Qt framework.
Without defining a python printer, all you will be able view is the pointer address, which is useless... Instead, in your ~/.lldbinit file add this line: command script import ~/.lldb/qstring.py (If this directory, or .lldb/, do not exist, create them.) Next, create the file
import lldb

def utf16string_summary(value, *rest):
    str_data = value.GetChildMemberWithName("d").GetChildMemberWithName("data")
    if str_data is None:
        return '""'
    length_vo = value.GetChildMemberWithName("d").GetChildMemberWithName("size")
    length = length_vo.GetValueAsUnsigned(0)
    if length == 0:
        return '""'
    data = str_data.GetPointeeData(0, length)
    error = lldb.SBError()
    bytes = data.ReadRawData(error, 0, 2*length)
    return '"%s"' % (bytes.decode('utf-16').encode('utf-8'))

def __lldb_init_module(debugger, *rest):
    print "registering QString"
    summary = lldb.SBTypeSummary.CreateWithFunctionName("qstring.utf16string_summary")
    summary.SetOptions(lldb.eTypeOptionHideChildren)
    debugger.GetDefaultCategory().AddTypeSummary( lldb.SBTypeNameSpecifier("QString", False), summary )
This tells LLDB to access the $var.d->data member (which is where QString keeps the actual chars) and convert it into a string, using the size. The following screenshots show the content of a QString with and without a printer: No QString printer 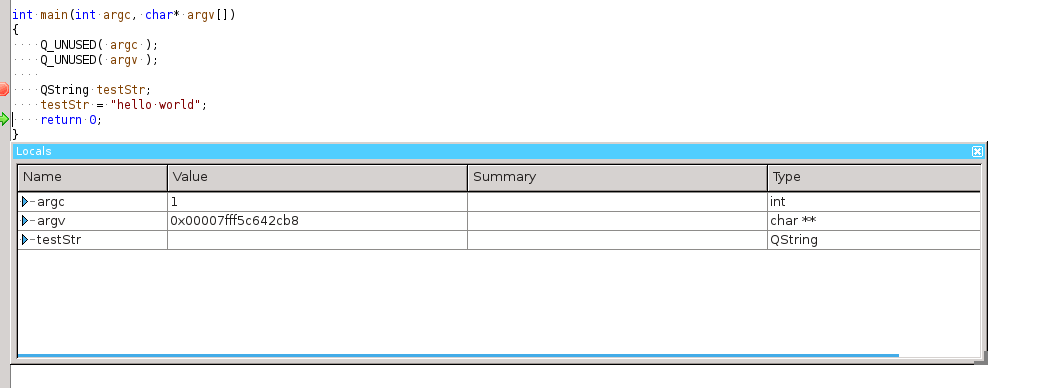 With QString printer 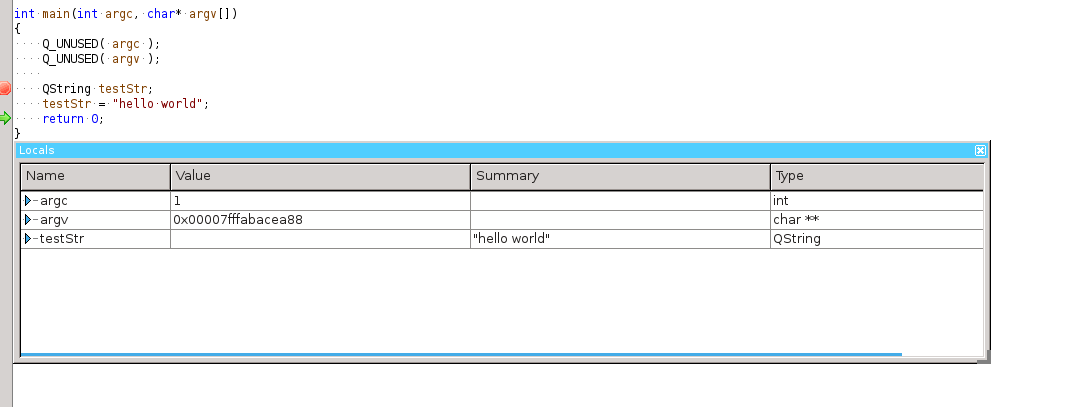 Basic typesIn many cases, python printers is not needed and you can settle for a simple printer using the The syntax is very simple and explained in detail here. You can add your own types to the LLDB Settings dialog: 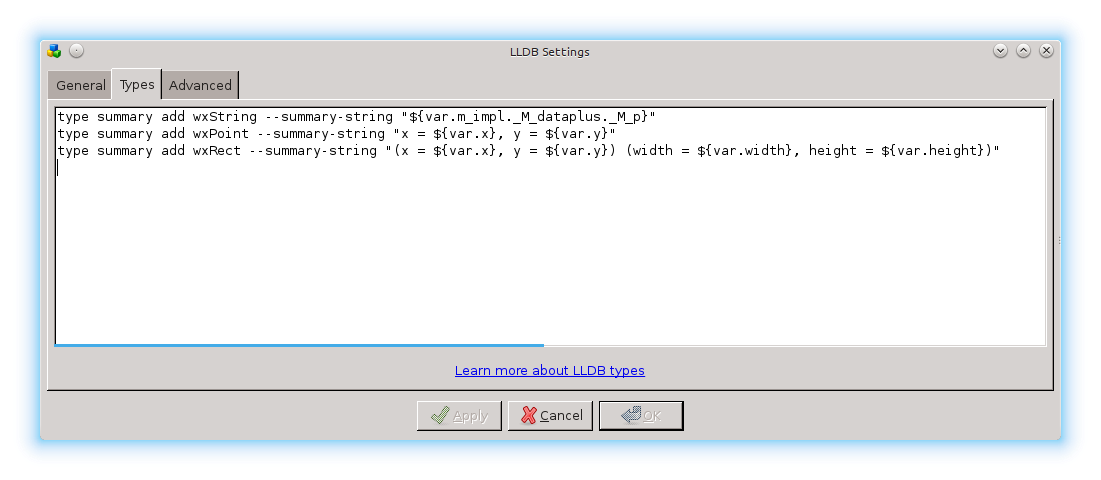 Debugger TooltipIn order to trigger the debugger tooltip, you need to place the mouse pointer over the variable you wish to explore and hold down the CTRL or CMD key By default the debugger will try to evaluate the word under the caret, if for some reason you wish to view a more complex expression, select it with the mouse and then click the CMD or CTRL key |